
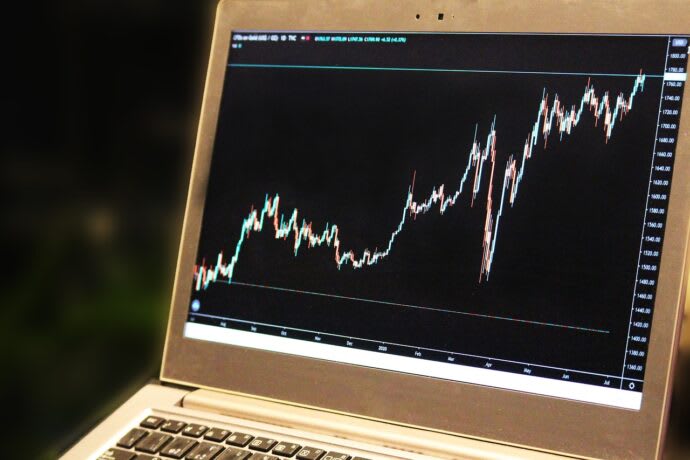
These charts, with their distinctive shapes and patterns, serve as a visual narrative of price movements, offering traders insights into market dynamics. For those taking their initial steps into this world, understanding the anatomy of candlestick charts is akin to unlocking a door to a realm of possibilities.
Introduction to Candlestick Charts
Candlestick charts are a fundamental tool in the world of crypto trading, providing valuable insights into the price movements of cryptocurrencies. These charts offer a visual representation of market data, allowing traders to analyze trends, identify potential reversals, and make informed decisions. For beginners entering the exciting realm of crypto trading, understanding candlestick charts is a crucial skill. Let's explore the basics:
Anatomy of a Candlestick
Body:
- The rectangular-shaped portion of the candlestick is called the "body." It represents the price range between the opening and closing prices during a specific time period.
Wicks (or Shadows):
- The thin lines extending above and below the body are known as "wicks" or "shadows." The upper wick represents the highest price reached, while the lower wick represents the lowest price during the chosen time frame.
Different Types of Candlesticks
Bullish Candlestick:
- A bullish candlestick has a green or white body, indicating that the closing price is higher than the opening price. This suggests upward price movement.
Bearish Candlestick:
- A bearish candlestick has a red or black body, signifying that the closing price is lower than the opening price. This implies downward price movement.
Doji:
- A doji has a small or non-existent body, with wicks extending both above and below. It indicates market indecision and suggests potential trend reversal.
Reading Candlestick Patterns
Engulfing Patterns:
- Bullish Engulfing: Occurs when a smaller bearish candle is followed by a larger bullish candle, signaling a potential upward reversal.
- Bearish Engulfing: The opposite, with a smaller bullish candle followed by a larger bearish candle, suggesting a potential downward reversal.
Hammer and Shooting Star:
- Hammer: A single candlestick with a small body and a long lower wick, indicating potential bullish reversal.
- Shooting Star: Similar to a hammer but appears at the top of an uptrend, suggesting potential bearish reversal.
Morning Star and Evening Star:
- Morning Star: A bullish reversal pattern comprising three candlesticks – a long bearish candle, a small bullish or bearish candle, and a long bullish candle.
- Evening Star: The bearish counterpart to the morning star, signaling potential trend reversal.
Time Frames and Interpretation
Time Frames:
- Candlestick charts can be viewed over different time frames, such as 1-minute, 1-hour, daily, etc. Shorter time frames provide more granular details, while longer time frames offer a broader perspective.
Patterns on Different Time Frames:
- It's essential to recognize that a pattern on a shorter time frame may have different implications than the same pattern on a longer time frame. Consider the context of the overall trend.
Candlestick charts are a powerful tool for crypto traders, offering a visual representation of price movements and trends. By understanding the anatomy of candlesticks, recognizing different candlestick patterns, and considering the time frames, beginners can gain valuable insights into market dynamics. Practice and experience are key to mastering the art of reading candlestick charts, so immerse yourself in the world of crypto charts and hone your skills over time.