
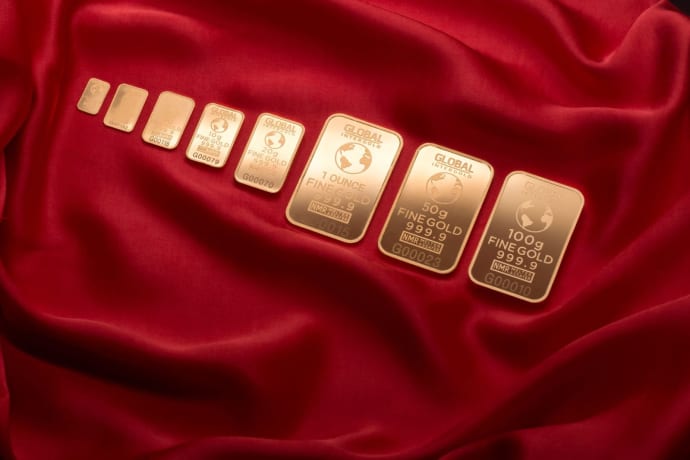
What to Know
- Gold lost ground despite a weaker U.S. dollar, a backdrop that is usually supportive for dollar denominated commodities.
- The U.S. dollar pulled back against a broad basket of currencies as forex traders took profits near yearly highs.
- The yield on 2 year Treasuries moved above 4.81% as traders continued to price the risk that the Fed may need to raise rates to fight inflation.
- The FedWatch Tool showed a 23.8% probability of a rate hike at the next meeting in October, while markets expected a rate increase in December.
- The 10 year Treasury yield pulled back toward 5.22%, and the 30 year Treasury yield declined below 5.58%.
- Gold traders appeared more focused on short term yield dynamics than on the pullback in longer dated Treasury yields.
- Gold attempted to settle above resistance at $4160 to $4180 but lost momentum and moved back toward the $4150 level.
- If gold settles below $4160, technical traders may look for a move toward $4100, followed by support at $4000 to $4020 if $4100 fails.
- Silver retreated as the gold to silver ratio climbed above the psychologically important 70.00 level.
- Silver was trying to settle below $59.00, with nearby support in the $56.00 to $57.00 range and a deeper downside target near $52.00 if selling pressure accelerates.
- Platinum came under strong pressure after failing to settle above $1700 to $1720 and sliding toward $1650.
- Palladium was down by 1.3%, adding a bearish tone for platinum traders.
Gold Weakens Even as the Dollar Pulls Back
Gold remained under pressure as the metal attempted to settle below the $4150 area, highlighting a notable disconnect between bullion and the U.S. dollar. A softer dollar often provides support for gold because the metal is priced in dollars and can become more attractive to buyers using other currencies. In this session, however, that supportive currency backdrop was not enough to stop the pullback in precious metals.
The dollar eased against a broad basket of currencies as forex traders took some profits off the table near yearly highs. That move would normally be viewed as a positive input for gold, silver, platinum, and other dollar denominated commodities. Instead, market participants focused on the rates side of the equation, where shorter term Treasury yields continued to signal concern that monetary policy may remain restrictive.
For gold, the rate environment remains one of the most important macro drivers. The metal does not offer yield, so rising bond yields can increase the opportunity cost of holding bullion. When investors can earn higher returns from government debt, some capital that might otherwise move into gold may remain in interest bearing instruments. That dynamic appeared to weigh on sentiment even as the dollar lost some ground.
Short Term Yields Keep Pressure on Bullion
The yield on 2 year Treasuries moved above the 4.81% level as traders continued to bet that the Fed may be forced to raise rates to fight inflation. The move in short term yields mattered more for gold traders than the recent pullback in longer dated bonds. The FedWatch Tool indicated a 23.8% probability of a rate hike at the next meeting in October, while the market expected that the Fed would raise rates in December.
Longer dated bonds showed a different tone. The yield on 10 year Treasuries pulled back toward the 5.22% level, while the yield on 30 year Treasuries declined below 5.58%. That suggested some demand returning for longer dated debt. Still, gold traders appeared to focus on the front end of the yield curve, where expectations for Fed policy tend to have a more direct impact.
This split in the Treasury market created a mixed backdrop for bullion. On one hand, lower long term yields can help risk sentiment and reduce pressure on assets sensitive to discount rates. On the other hand, firm short term yields reinforce the message that the market is not ready to dismiss the possibility of tighter policy. For gold, the latter signal dominated trading behavior.
Technical Traders Watch $4160 and $4100
From a technical perspective, gold attempted to settle above the resistance area at $4160 to $4180, but the move lacked follow through. The failure to hold above that zone encouraged a retreat toward the $4150 level. For chart watchers, this price action keeps the market vulnerable unless buyers quickly reclaim the recently tested resistance band.
If gold settles below $4160, technical traders may look for a move toward the $4100 level. A break below $4100 would be viewed as a deeper bearish signal and could open the way for a test of support at $4000 to $4020. Those levels may attract attention because round numbers often act as psychological reference points in fast moving commodities markets.
At the same time, the broader setup is not one dimensional. Gold remains sensitive to shifts in Fed expectations, Treasury yields, the dollar, and geopolitical uncertainty. A sharp decline in short term yields or a renewed wave of defensive demand could still limit downside pressure. For now, however, the immediate technical message is that buyers failed to sustain control above $4160 to $4180.
Oil and Middle East Tensions Add Macro Complexity
Oil prices gained some ground as traders focused on escalation in the Middle East. President Trump said that Houthis were behaving very badly and accused them of trying to drive up oil prices. His comments signaled that the U.S. could put pressure on the Houthis, although oil markets did not rally after the remarks.
For precious metals, energy market developments matter because oil can influence inflation expectations. Higher oil prices may keep inflation concerns alive, which can support the case for tighter monetary policy. That can be negative for gold when the rates channel dominates. At the same time, geopolitical risk can sometimes support demand for gold as a defensive asset. The latest market response showed that traders were not treating geopolitical headlines as enough to offset the pressure from short term yields.
Silver Slides as the Gold to Silver Ratio Rises
Silver retreated as the gold to silver ratio climbed above the psychologically important 70.00 level. The ratio measures how many ounces of silver are needed to buy one ounce of gold. When the ratio rises, silver is underperforming gold. Market participants often watch this indicator to gauge relative strength across the precious metals complex.
If the gold to silver ratio settles above 70.00, it may head toward the 72.00 level, which would be bearish for silver. That risk is important because silver can be more volatile than gold and is often affected by both investment demand and industrial sentiment. When the ratio moves higher during a broad precious metals pullback, silver traders may become more cautious.
Silver was trying to settle below the $59.00 level. If that attempt is successful, the next support zone sits in the $56.00 to $57.00 range. A move below $56.00 could give silver a chance to gain additional downside momentum, with traders then watching the $52.00 level. The relative strength index was described as being in moderate territory, meaning there was still room for momentum to build if the right catalysts emerged.
Platinum Faces Pressure Near $1650
Platinum also came under strong pressure as the pullback in precious metals broadened. The market failed to settle above resistance at $1700 to $1720 and declined toward the $1650 level. That failed breakout attempt left platinum exposed to further selling if buyers are unable to defend the nearby area.
Palladium markets were down by 1.3%, which added another bearish signal for platinum. The two metals are often watched together because both are used in industrial applications and can be influenced by similar demand themes. Weakness in palladium can weigh on sentiment toward platinum, especially when the broader precious metals complex is already under pressure.
If platinum settles below $1650, traders may look for a move toward the nearest support in the $1600 to $1620 range. A successful test of that support zone could then open the way to a test of the $1520 level. As with gold and silver, the immediate outlook depends on whether buyers can stabilize prices near current support or whether broader liquidation continues across the sector.
Market Outlook for Precious Metals
The latest action in gold, silver, and platinum shows that a weaker dollar alone is not always enough to lift precious metals. Traders are weighing the dollar move against persistent pressure from short term Treasury yields and the possibility of additional Fed tightening. That combination has kept the metals complex on the defensive despite currency market support.
Gold remains the key market to watch because its behavior often sets the tone for the rest of the precious metals sector. A sustained move below $4160 could keep pressure on bullion and may encourage additional selling in silver and platinum. Conversely, a rebound above the $4160 to $4180 resistance zone would suggest that buyers are attempting to regain control.
For now, the sector is trading with a cautious bias. Silver is vulnerable while the gold to silver ratio remains above 70.00, and platinum needs to defend $1650 to avoid a deeper test of support. The near term direction will likely depend on whether short term yields continue to rise and whether Fed expectations become more aggressive ahead of the October and December policy timeline watched by market participants.
Frequently Asked Questions (FAQs)
Why did gold fall even though the U.S. dollar weakened?
Gold fell because traders focused more on short term Treasury yields and Fed rate expectations than on the weaker dollar. A softer dollar is usually supportive for gold, but higher short term yields can increase the opportunity cost of holding the metal.
What level is important for gold right now?
The $4160 level is a key near term marker. If gold settles below $4160, technical traders may look for a move toward $4100, followed by support at $4000 to $4020 if selling pressure continues.
What resistance did gold fail to hold?
Gold attempted to settle above the $4160 to $4180 resistance area but lost momentum. That failure pushed the market back toward the $4150 level.
How are Treasury yields affecting gold?
The 2 year Treasury yield moved above 4.81%, reinforcing expectations that the Fed may need to keep policy tight or raise rates. Higher short term yields can weigh on gold because the metal does not provide income.
What does the FedWatch Tool show?
The FedWatch Tool showed a 23.8% probability of a rate hike at the next meeting in October. Market participants also expected that the Fed would raise rates in December.
Why is silver under pressure?
Silver is under pressure because the gold to silver ratio climbed above 70.00, signaling silver underperformance versus gold. Silver was also trying to settle below $59.00, which could expose support at $56.00 to $57.00.
What happens if silver breaks below $56.00?
If silver moves below $56.00, it may gain additional downside momentum. In that case, chart watchers may focus on the $52.00 level as the next major downside area.
Why is platinum weakening?
Platinum weakened after failing to settle above resistance at $1700 to $1720 and sliding toward $1650. Weakness in palladium, which was down by 1.3%, also added pressure to platinum sentiment.
What support levels are traders watching in platinum?
If platinum settles below $1650, traders may watch the $1600 to $1620 support range. A successful test of that area could open the way to the $1520 level.