
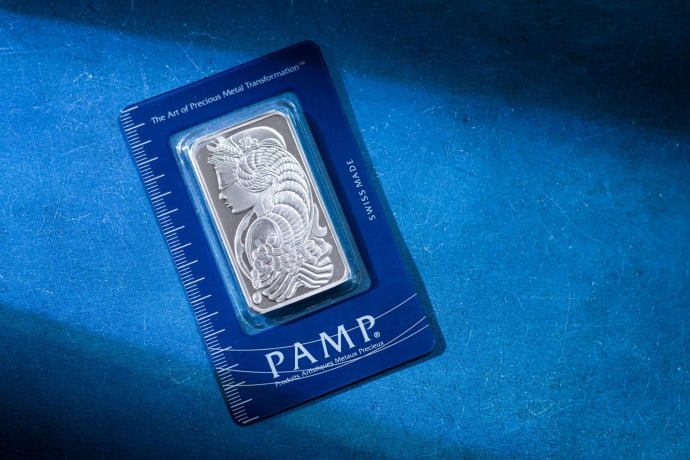
What to Know
- Silver has dropped to approximately $47.42 after breaking key support, extending a bearish technical trend.
- December silver futures recently closed at $49.121, their lowest close since October 27, 2025, before falling further on Sunday evening.
- Gold futures are trading near $3,864.77 after breaking below support at $3,957.85 and moving to new 2026 lows.
- The gold-to-silver ratio has risen from 77.6 on Thursday to 79.1 on Friday and about 82.7 today.
- A ratio above 80 can make silver appear inexpensive relative to gold, but past downturns show that it is not necessarily a standalone buy signal.
- Since October 1, when silver traded near $61, the metal has declined by about 23 percent.
- Since September 25, when gold futures traded near $4,320, gold has declined by about 10 percent.
- Federal Reserve officials remain hawkish, with a 25-basis-point hike on December 9 fully priced in fed funds futures.
- The 10-year Treasury yield closed at 5.15 percent on Friday, its highest close since October 14.
- USD Index futures have moved up to 103.475, another 2026 high, adding pressure to dollar-priced precious metals.
Silver Breaks Support as Selling Pressure Accelerates
Silver is leading the latest leg lower in precious metals, sliding to approximately $47.42 after breaking a key support area. The move has reinforced a bearish technical structure that had already been developing through a sequence of failed rebounds and lower price levels. For market participants watching momentum, the speed of the decline has been as important as the level itself, because silver has repeatedly shown brief bursts of strength just before renewed selling pressure.
The decline has not unfolded in a straight line. Silver’s rallies have offered moments of relief, but those recoveries have also marked important short-term tops along the way. On October 1, silver traded near $61, and since then it has fallen by about 23 percent. That drop has changed the tone of the market from consolidation to a more decisive breakdown, with technical traders now focused on whether lower extension levels come into play.
The latest sequence showed how fragile silver’s rebounds have become. On Wednesday, December silver futures rallied $0.777 while gold declined $29.70. The outperformance did not last. On Thursday, silver lost $1.937, and on Friday it fell another $0.944 to close at $49.121, its lowest close since October 27, 2025. Gold, by contrast, closed $1.00 higher on Friday. Then, on Sunday evening, silver dropped from about $48.75 to below $47.50 within an hour, underscoring how quickly liquidity and sentiment can shift in a weakening market.
Gold-to-Silver Ratio Moves Above 80
The gold-to-silver ratio is drawing renewed attention as the metals diverge in pace. The ratio measures how many ounces of silver one ounce of gold can buy. It moved from 77.6 on Thursday to 79.1 on Friday and is about 82.7 today. A reading above 80 often attracts attention because it can make silver appear cheap relative to gold. However, a high ratio does not automatically mean that silver is ready to rally.
In major declines, silver often falls faster than gold. That relative underperformance can push the ratio higher even while both metals weaken. This is why some chart watchers treat a rising ratio as a sign of stress rather than value. A potential bottoming process usually requires more than a high ratio. It often involves a turn lower in the ratio while gold is still close to its lows, alongside leadership from mining stocks. Those conditions are not yet clearly visible in the current setup.
The 2013 comparison remains central for many technical traders. Based on June 2013 gold futures and July 2013 silver futures, the ratio was 55.2 on March 21, 2013, at the top of gold’s final rebound. It stood at 58.6 on April 16, at the low of the April crash, and reached 66.2 on June 26, close to gold’s June 2013 low. The lesson for current markets is that a rising ratio during a selloff can persist, and it may not deliver a clean contrarian buy signal until broader evidence of stabilization appears.
Gold Extends Breakdown to New 2026 Lows
Gold is also weakening, trading near $3,864.77 after breaking below support at $3,957.85. The move has pushed futures to new 2026 lows and confirmed the pressure visible in the broader precious metals complex. On September 25, gold futures traded near $4,320. Since that point, gold has fallen by about 10 percent, a decline that has unfolded through a back-and-forth phase followed by a more decisive break lower.
The recent price action has similarities to the pattern seen in 2013, during the gold bear market that began in 2011. In that earlier period, gold moved below its pre-rebound low on April 3, closed below it on April 4, rebounded for three sessions, and then crashed from April 12. In the current market, gold closed below its 2026 lows on October 30, moved below its October 30 low on Thursday, paused for one session, and then reached new 2026 lows today.
Some technical traders view the current moves as faster than the 2013 sequence, consistent with the sharper pace that has characterized the market since the August top. That does not mean the path lower will be smooth, but it does keep attention on downside targets. In this framework, some chart watchers see gold as vulnerable to a decline toward about $3,500 if the breakdown continues and if macro conditions remain unfavorable for precious metals.
Federal Reserve Signals Keep Pressure on Metals
The macro backdrop is adding to the technical pressure. Federal Reserve officials have continued to make hawkish comments, reinforcing the view that policy may remain restrictive. On Sunday, Kansas City Fed President Jeff Schmid said inflation is still “running too hot” and that the Fed has “some work to do.” Fed funds futures continue to fully price a 25-basis-point hike on December 9.
Higher interest rates can weigh on gold and silver because precious metals do not offer yield. When Treasury yields rise, the opportunity cost of holding metals tends to increase. That dynamic can become even more difficult for metals when the dollar is also strengthening, because gold and silver are typically priced in dollars. A stronger dollar can make these assets more expensive for buyers using other currencies and can reduce demand at the margin.
The 10-year Treasury yield closed at 5.15 percent on Friday, its highest close since October 14. At the same time, USD Index futures moved up to 103.475, another 2026 high. Together, these conditions form a challenging backdrop for metals. Even geopolitical stress in the Gulf over the weekend did not trigger a durable gold rally. For some market participants, gold’s failure to rise on news that might normally support safe-haven demand is itself bearish information.
Silver’s Outperformance Turns Into a Warning Sign
Silver can outperform gold in powerful rallies because of its smaller market size, dual role as a precious and industrial metal, and higher volatility. But that same volatility can become a liability when the market turns lower. The recent pattern, where silver strength quickly reversed into steep losses, suggests that buyers have struggled to maintain control after short-lived advances.
The Wednesday rally in December silver futures stood out because it occurred while gold declined. In isolation, that kind of move might appear constructive. However, the follow-through was negative, with large losses on Thursday and Friday and a sharp Sunday evening drop. This sequence has made silver’s relative strength look less like accumulation and more like a final burst before renewed downside.
For traders, the key issue is whether silver can reclaim broken levels and stabilize, or whether the breakdown accelerates toward lower targets. The market is currently treating failed rallies with caution. Until silver stops making lower closes and the gold-to-silver ratio begins to ease in a more constructive way, technical traders are likely to remain defensive.
What Comes Next for Precious Metals
The precious metals market is now navigating a difficult combination of bearish chart signals, rising yields, a stronger dollar and hawkish Federal Reserve commentary. Silver has fallen below $48 after having traded near $61 on October 1. Gold has broken below key support and moved to new 2026 lows after trading near $4,320 on September 25. The gold-to-silver ratio has moved above 80, showing that silver is underperforming gold during the decline.
None of these factors guarantees a straight-line move lower. Precious metals can stage sharp countertrend rebounds, especially after fast declines. However, rebounds in weak markets need confirmation. For now, the burden of proof remains on buyers to show that support is returning. Without that confirmation, the market’s attention is likely to remain on lower technical levels, including the possibility that gold moves toward about $3,500.
For investors and traders, the main takeaway is that relative value signals need context. A high gold-to-silver ratio can be meaningful, but it is not enough on its own. In a falling market, silver can continue to weaken faster than gold, pushing the ratio higher before a durable low forms. The more constructive signal would be a shift in leadership, with silver stabilizing, the ratio turning lower, and related precious metals assets confirming improved risk appetite.
Frequently Asked Questions (FAQs)
Why is silver falling?
Silver is falling after breaking key support near approximately $47.42, with bearish technical momentum, a stronger dollar and rising interest rate expectations adding pressure. Recent rebounds have failed to hold, which has kept sellers in control.
What is the gold-to-silver ratio?
The gold-to-silver ratio shows how many ounces of silver one ounce of gold can buy. It is currently about 82.7, after rising from 77.6 on Thursday and 79.1 on Friday.
Does a gold-to-silver ratio above 80 mean silver is cheap?
A ratio above 80 can make silver look inexpensive relative to gold, but it is not a buy signal by itself. During declines, silver can fall faster than gold, causing the ratio to rise even as both metals weaken.
Where is gold trading now?
Gold is trading near $3,864.77 after breaking below support at $3,957.85 and moving to new 2026 lows. Since September 25, when gold futures traded near $4,320, gold has declined by about 10 percent.
What role is the Federal Reserve playing?
Hawkish Federal Reserve commentary is pressuring precious metals. Kansas City Fed President Jeff Schmid said inflation is still “running too hot” and that the Fed has “some work to do,” while a 25-basis-point hike on December 9 remains fully priced in fed funds futures.
Why do higher yields hurt gold and silver?
Higher yields can raise the opportunity cost of holding non-yielding assets such as gold and silver. The 10-year Treasury yield closed at 5.15 percent on Friday, adding to the pressure on precious metals.
Why does a stronger dollar matter for metals?
Gold and silver are priced in dollars, so a stronger dollar can make them more expensive for buyers using other currencies. USD Index futures have moved up to 103.475, another 2026 high, which is a headwind for metals.
Could gold still rebound on geopolitical risks?
Gold can rebound during periods of geopolitical stress, but the latest market reaction was weak. The weekend’s attacks in the Gulf did not trigger a rally, and some market participants view that failure to respond as bearish.
What level are traders watching for gold downside?
Some chart watchers see gold as vulnerable to a decline toward about $3,500 if the current breakdown continues and macro conditions remain unfavorable. That view remains a forecast, not a certainty.