
What to Know
- Gold and silver remain under pressure ahead of the Federal Reserve’s interest rate decision.
- Gold reached a high of $4,116 on Monday before retreating toward $4,000.
- A stronger U.S. dollar and expectations for a hawkish Federal Reserve message have weighed on precious metals.
- The Federal Reserve could maintain interest rates at 3.50%-3.75%.
- Chairman Kevin Warsh could signal that rates may stay elevated while inflation remains above the 2% target.
- Softer U.S. economic data, including weaker consumer confidence in July and slower private sector hiring, has supported gold’s rebound attempts.
- Gold is consolidating below $4,200 resistance, with $3,950 acting as an important support area.
- A break below $3,950 may open the way toward the $3,800 area, while a move above $4,200 could target $4,500.
- Silver remains in a broad consolidation between $55 support and $64 resistance.
- A silver break below $55 may expose the $45 area, while a move above $64 could point toward $70-$72 and potentially $72.
Precious Metals Brace for the Fed
Gold and silver are entering a critical stretch as market participants focus on the Federal Reserve’s interest rate decision and the tone of its policy message. Both metals have struggled for direction as traders weigh the possibility of a hawkish signal against signs that the U.S. economy is losing some momentum. The outcome matters because precious metals tend to react sharply when expectations for interest rates, inflation, and the U.S. dollar shift at the same time.
Gold hit a high of $4,116 on Monday before sliding back toward $4,000, showing that buyers remain active but have not yet been able to regain full control. The retreat came as the U.S. dollar strengthened and as markets considered the possibility that the Federal Reserve may keep policy restrictive. If the central bank maintains interest rates at 3.50%-3.75% and delivers a message that rates need to stay elevated while inflation remains above the 2% target, the dollar could remain supported in the short term. That would likely create additional headwinds for gold and silver.
At the same time, the picture is not one sided. Softer data from the U.S. economy has helped support gold rebound attempts. Consumer confidence dropped in July, while the private sector began hiring fewer people. These developments could ease some pressure on policymakers to maintain a more aggressive tightening bias. If the Federal Reserve places greater emphasis on slower growth and employment risks, gold could rally as traders price in a less restrictive path.
Gold Holds a Tense Range Below $4,200
The technical backdrop for spot gold remains defined by consolidation below $4,200 resistance. Chart watchers view this area as a major hurdle because the metal has not yet shown enough strength to break decisively above it. As long as prices remain below $4,200, the market is likely to be viewed as vulnerable to renewed downside pressure, especially if the Fed reinforces support for the U.S. dollar.
The key downside level is $3,950. A failure to hold this support would be an important bearish signal for technical traders. If gold breaks below $3,950, the next major area in focus is $3,800. Such a move would suggest that the recent consolidation has resolved lower and that sellers have regained momentum. In that scenario, short term sentiment toward gold could weaken further, particularly if real yield and dollar pressures remain firm.
On the upside, a break above $4,200 would be needed to ease the pressure. If buyers can push spot gold through that ceiling, the move may open the path toward $4,500. That would mark a stronger recovery attempt and could encourage more bullish positioning among traders who have been waiting for confirmation that the metal can escape its current range.
Gold’s Shorter Term Pattern Shows Bearish Pressure
The shorter term chart structure also points to a market under strain. Spot gold has been trading near the edge of a triangle pattern that emerged from the January 2026 highs. Prices have shown bearish pressure since January 2026, and the earlier break below $4,500 pushed the market toward the $3,900-$4,000 area. That zone is now central to the near term outlook.
Technical traders are watching whether the triangle resolves lower or higher. A break below $3,950 would indicate downside resolution and could increase the probability of a move toward $3,800. By contrast, if the triangle breaks to the upside, $4,200 becomes the first immediate resistance. The direction of that break may be heavily influenced by how traders interpret the Fed’s policy guidance.
This setup leaves gold highly sensitive to incoming signals. A hawkish Fed message could pressure gold by lifting the U.S. dollar and keeping expectations for elevated rates intact. A softer message focused on slower growth and employment could help gold recover, especially if traders become less confident that restrictive policy will remain in place for an extended period.
Silver Consolidates Between $55 and $64
Silver is also caught in a broad consolidation pattern, with spot prices moving between $55 support and $64 resistance. Unlike gold, silver does not currently show a clear short term direction. The range is well defined, and traders are waiting for a breakout before taking a stronger view on the next directional move.
The $55 level remains the lower boundary of primary support. If silver breaks below this area, the move may push prices further downward toward the $45 area. That would signal a deterioration in the technical picture and suggest that sellers have taken control of the range. A breakdown of this kind could also reflect broader pressure on precious metals if the U.S. dollar strengthens after the Fed decision.
On the other side, $64 is the key resistance level. A confirmed break above $64 would likely indicate that silver is attempting to move out of the $55-$64 range. Such a move could point toward the $72 area and may improve sentiment across the silver market. Technical traders often treat range breakouts as important because they can mark the transition from sideways consolidation into a more directional phase.
Silver Needs a Push Above $60 to Ease Pressure
The shorter term silver chart shows prices trading near the lower boundary of a descending wedge pattern. Recent consolidation reflects considerable uncertainty, with neither buyers nor sellers showing enough conviction to force a decisive move. In this context, silver needs at least a push above $60 to ease bearish pressure in the market.
A move above $60 would not by itself confirm a full bullish breakout, but it would suggest that sellers are losing some control. The stronger signal would come from a confirmed break above $64. If that occurs, traders may look toward the $70-$72 area, which is defined by resistance from the descending wedge pattern. The broader upside reference remains $72 if momentum extends.
Until silver clears resistance, the risk of a renewed test of $55 remains. That level is particularly important because a downside break may expose the $45 area. For now, the market is range bound, and the Fed decision could provide the catalyst that determines whether silver continues sideways or begins a stronger move.
Dollar Reaction Could Drive the Next Move
The U.S. dollar remains a central factor for both metals. A hawkish Federal Reserve message could be bullish for the dollar and bearish for gold and silver in the short term. Higher rate expectations tend to increase the opportunity cost of holding non yielding assets, which can weigh on precious metals. A stronger dollar can also make dollar priced metals more expensive for buyers using other currencies.
However, if the Fed highlights slower growth and softer employment conditions, precious metals could find support. Gold in particular may benefit if traders interpret the message as reducing the likelihood of a more restrictive policy path. Silver could also respond positively, though its technical range between $55 and $64 remains the immediate guide for market direction.
For now, gold is stuck between $3,950 and $4,200, while silver continues to consolidate between $55 and $64. These levels are likely to define the next major move. A clean break in either direction could shift sentiment quickly, especially if it aligns with the dollar’s reaction after the Federal Reserve decision.
Frequently Asked Questions (FAQs)
Why are gold and silver under pressure?
Gold and silver are under pressure because traders are preparing for the Federal Reserve’s interest rate decision, while a stronger U.S. dollar and expectations for a hawkish policy message have weighed on metals.
What level is most important for gold support?
The key gold support level is $3,950. A break below that area may open the door for a deeper move toward the $3,800 area.
What level does gold need to break to improve its outlook?
Gold needs to break above $4,200 resistance to ease current pressure. If that happens, technical traders may look for a move toward $4,500.
What is the current silver trading range?
Silver is consolidating between $55 support and $64 resistance. A breakout from this range is expected to define the next major directional move.
What happens if silver breaks below $55?
If silver breaks below $55, the technical picture may weaken and prices could move further downward toward the $45 area.
What happens if silver breaks above $64?
A confirmed break above $64 would suggest that silver is attempting to move out of its current range and could point toward the $70-$72 area, with $72 also in focus as an upside level.
How could the Federal Reserve affect gold and silver?
A hawkish Federal Reserve message could support the U.S. dollar and pressure gold and silver. A message focused on slower growth and employment risks could help gold rebound and may also support silver.
Why does the U.S. dollar matter for precious metals?
Gold and silver are priced in U.S. dollars, so a stronger dollar can make them less attractive to some buyers. Dollar strength can also reflect expectations for tighter monetary policy, which may pressure non yielding assets like gold.
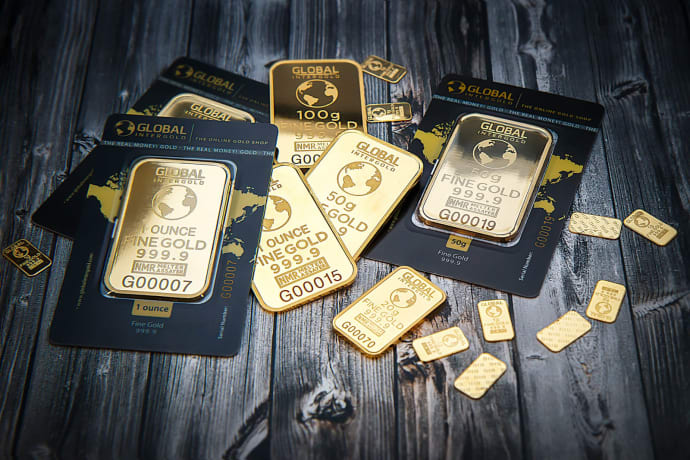
Photo by Michael Steinberg on Pexels