
WTI Crude Oil Correction Deepens Toward Key Support
What to Know
- Bearish wedge breakdown targets $85.50 zone.
- Sellers control below the 10- and 20-day averages.
- Counter-trend rally capped near falling 20-day MA.
- Volatility spike points to 50-day support test.
- Weekly structure intact but double top risk builds.
Exhaustion at the Top, Trend Behavior Shifts
WTI crude oil has moved into a corrective phase following a spike high of $119.54 on March 9. Buyers quickly reached exhaustion at that point, resulting in a sharp intraday decline and a weak close in the lower third of the day’s range. The rally was showing clear signs of failure by then, and crude oil has been in a corrective phase since that peak. A second, and slightly lower high of $109.62, was reached last week, which led to a continuation of the correction and reinforced the shift in trend behavior established at the March peak.
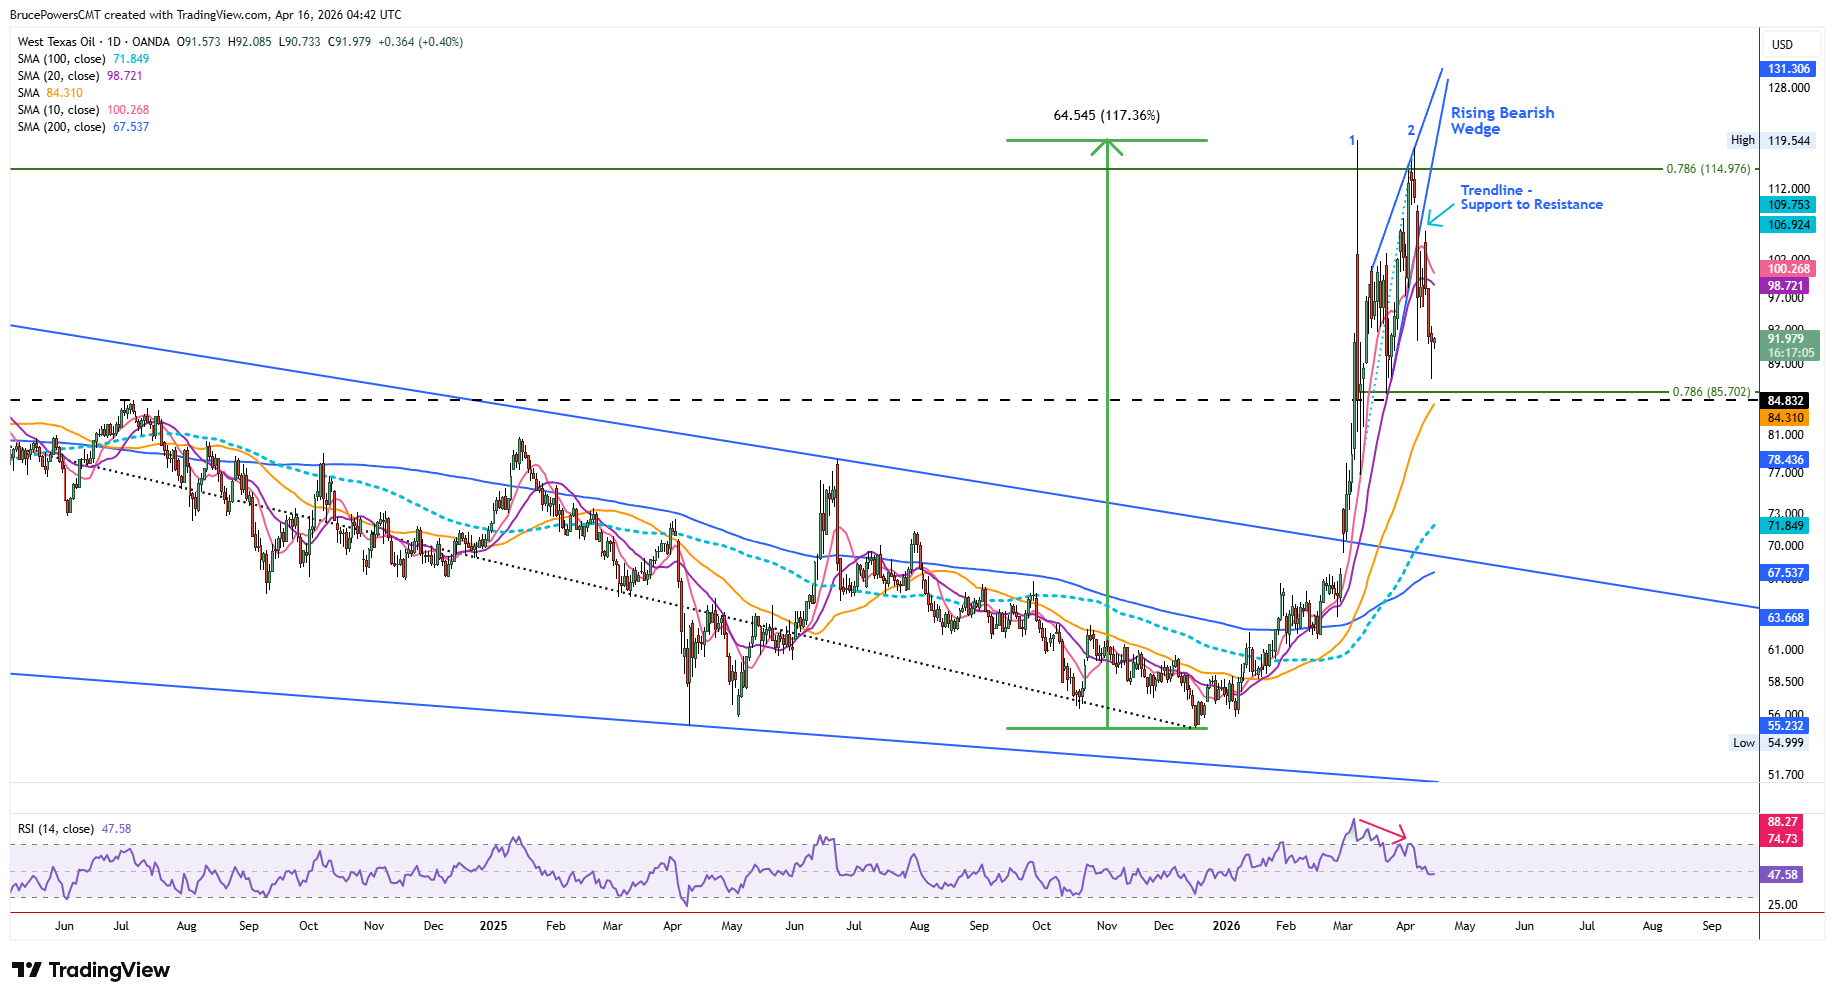
Bearish Wedge Breakdown Sets Near-Term Targets
Crude oil is now in its second leg down from that second high after breaking below the 10-day and 20-day moving averages. The decline has formed a rising bearish wedge pattern, with an initial target around $85.50. That is a close match with the 78.6% Fibonacci retracement of the recent upswing at $85.70. So far, support was found at $87.22 but sellers remain in control.

Counter-Trend Bounce Faces Overhead Pressure
Nevertheless, a second counter trend rally to test prior support as resistance could reach the 20-day moving average, currently at $98.67 and trending lower. A bullish hammer candle formed on the daily chart for Wednesday with a bullish signal indicated above $93.54. But with potential resistance near the 20-day average, upside appears limited. A failure of support at the 10-day and 20-day moving averages has just occurred, signaling a clear change in character where downside risk and choppy consolidation are likely to dominate near-term price action.
Volatility Spike Points to 50-Day Test
Given the recent spike in volatility, a continuation of the corrective phase looks likely until the 50-day moving average is tested as support. It commonly triggers a market reaction on the first test, but not always. The reclaim of the 50-day moving average on January 12 has not yet been meaningfully tested as support since the breakout, other than shortly after the reclaim. The first test of support at this common trend indicator could attract buyers, followed by increased demand and a bullish reversal. This would represent the more constructive bullish scenario within the broader corrective structure.
Higher Timeframe Breakout Still in Play
When expanding the view of price history back to the start of the long-term bull trend in April 2020 with a low around $11.10, the recent breakout of a falling bullish wedge pattern can be seen. The breakout zone was confirmed by the convergence of several weekly moving averages, including the 10-week, 20-week, and 100-week timeframes. This is potentially significant because it points to the technical significance of the wedge breakout, suggesting the potential for a second major leg higher following the current correction.
Overbought Conditions Raise Double Top Risk
This outlook is further complicated by the extreme overbought level on the weekly relative strength index (RSI) and the second high, which raises the possibility of a double top. Since there has not yet been a first pullback to test prior significant trend resistance levels as support since the March breakout, that remains a key risk to monitor.
Key Weekly Support Zones to Watch
The first weekly support level at the 10-week moving average was hit this week and held. Lower down is the more significant 200-week moving average at $76.16. To wring excess volatility out of the market, a decline to test support at that longer-term average could help complete the current corrective cycle, bringing price back toward a level where the broader bullish structure may attempt to reassert itself, thereby reconnecting with the initial exhaustion signal that began this correction in March. Other than that, the 100-week moving average at $70.18 is now above the downtrend line and marks another key support zone if crude oil continues lower in the coming weeks or months.
For more daily forecasts and in-depth analysis on West Texas Intermediate (WTI), visit our Commodities Forecasts section and stay ahead of market trends.
Top Exchanges
1
 Start Trading
Trading cryptocurrencies involves significant risk and users should carefully consider their investment objectives and risk tolerance.
2
 Start Trading
Cryptocurrency trading carries a high level of risk and users should carefully evaluate their financial situation and risk tolerance before participating.
3
 Start Trading
Don’t invest unless you’re prepared to lose all the money you invest. This is a high-risk investment and you should not expect to be protected if something goes wrong.
4
 Start Trading
Trading cryptocurrencies involves high risk and users should thoroughly evaluate their financial circumstances and risk tolerance.
5
 Start Trading
Cryptocurrency trading involves substantial risk and users should carefully assess their investment goals and risk tolerance before participating.
6
 Start Trading
Trading cryptocurrencies carries inherent risks and users should carefully consider their investment objectives and risk tolerance.
7
 Start Trading
Cryptocurrency trading involves significant risk and users should evaluate their financial situation and risk tolerance before participating.
8
 Start Trading
Trading cryptocurrencies carries inherent risks and users should carefully assess their investment objectives and risk tolerance before engaging.
Comments (0)
Loading...