The charts are always telling a story — we just need to learn how to read it.
FAVORITE TRADING QUOTE / PHILOSOPHY
About
Bruce Powers has spent over 25 years immersed in the financial markets, honing his expertise across stocks, ETFs, Forex, cryptocurrencies, and commodities. A Chartered Market Technician (CMT) with an MBA in Finance from the University of Arizona’s Eller College of Management, Bruce is a private trader who has published hundreds of articles on trading and technical analysis for both print and online publications.
He currently produces daily technical analysis on commodities for FXEmpire, writes a monthly column on penny stocks for Investopedia, and spent nine years as a weekly technical analysis columnist for the Gulf News in Dubai. Beyond the written page, Bruce has appeared more than 150 times on TV business news programs, sharing his market insights with a wide audience.
GBP/JPY has confirmed a major breakout above long-term resistance, with multiple bullish signals indicating the uptrend may continue following any near-term pullback.
Brent and WTI crude are showing similar bullish bottoming patterns as key support holds, with confirmation of recent reversal signals potentially setting the stage for another advance.
USD/JPY shows early bearish reversal signals after a bearish outside day and channel break, with key support levels now under pressure and downside targets emerging.
Natural gas shows a bullish reversal from a falling wedge, reclaiming key moving averages. A pennant consolidation suggests continuation, with higher resistance targets forming above.
Gold and silver continue to weaken beneath major moving averages as bearish continuation patterns raise the risk of deeper corrective declines toward long-term support.
WTI crude oil remains in a corrective phase following a March peak, with bearish patterns and rising volatility pointing to further downside toward key moving average support zones.
EUR/USD faces strong resistance near recent highs, with technical structure pointing to potential downside risk unless key support zones hold and bullish momentum resumes.
U.S. equity indices remain under pressure as breakdowns below key moving averages and failed rallies point to a likely continuation of the current correction.
EUR/JPY tests a critical support confluence within a developing bull flag, with price action near 180.80 likely to determine whether the broader uptrend resumes.
Spot silver reversed sharply from record highs, triggering a bearish correction, though emerging support and reversal signals suggest a potential counter-trend rally may be developing.
Gold maintains its long-term uptrend above key weekly averages, but resistance near a 600% extension raises the possibility of a deeper correction without a decisive breakout.
GBP/USD continues to consolidate within a rising channel as traders weigh a potential channel breakdown and double top against support strength near trendline.
Bitcoin’s weekly chart shows a bullish reversal on a breakout to a three-week high, following validation of support at a key moving average. Confirmation of the breakout hints at momentum toward $135,000 and potentially higher.
XRP is consolidating within a large bullish pattern that stretches back to 2018. Technical setups point toward an eventual successful breakout, with key levels and targets now in focus.
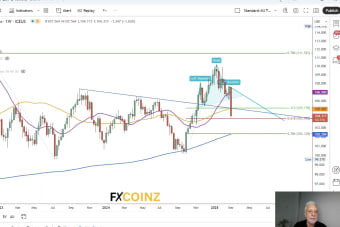
A breakdown from a head and shoulders topping pattern triggered this week in the U.S. dollar index (DXY) on a decisive decline below last week’s low of $106.13.
 ✓
✓